Digital Framework Case Study in Dashboard Design: Designing the Full Dashboard
Background
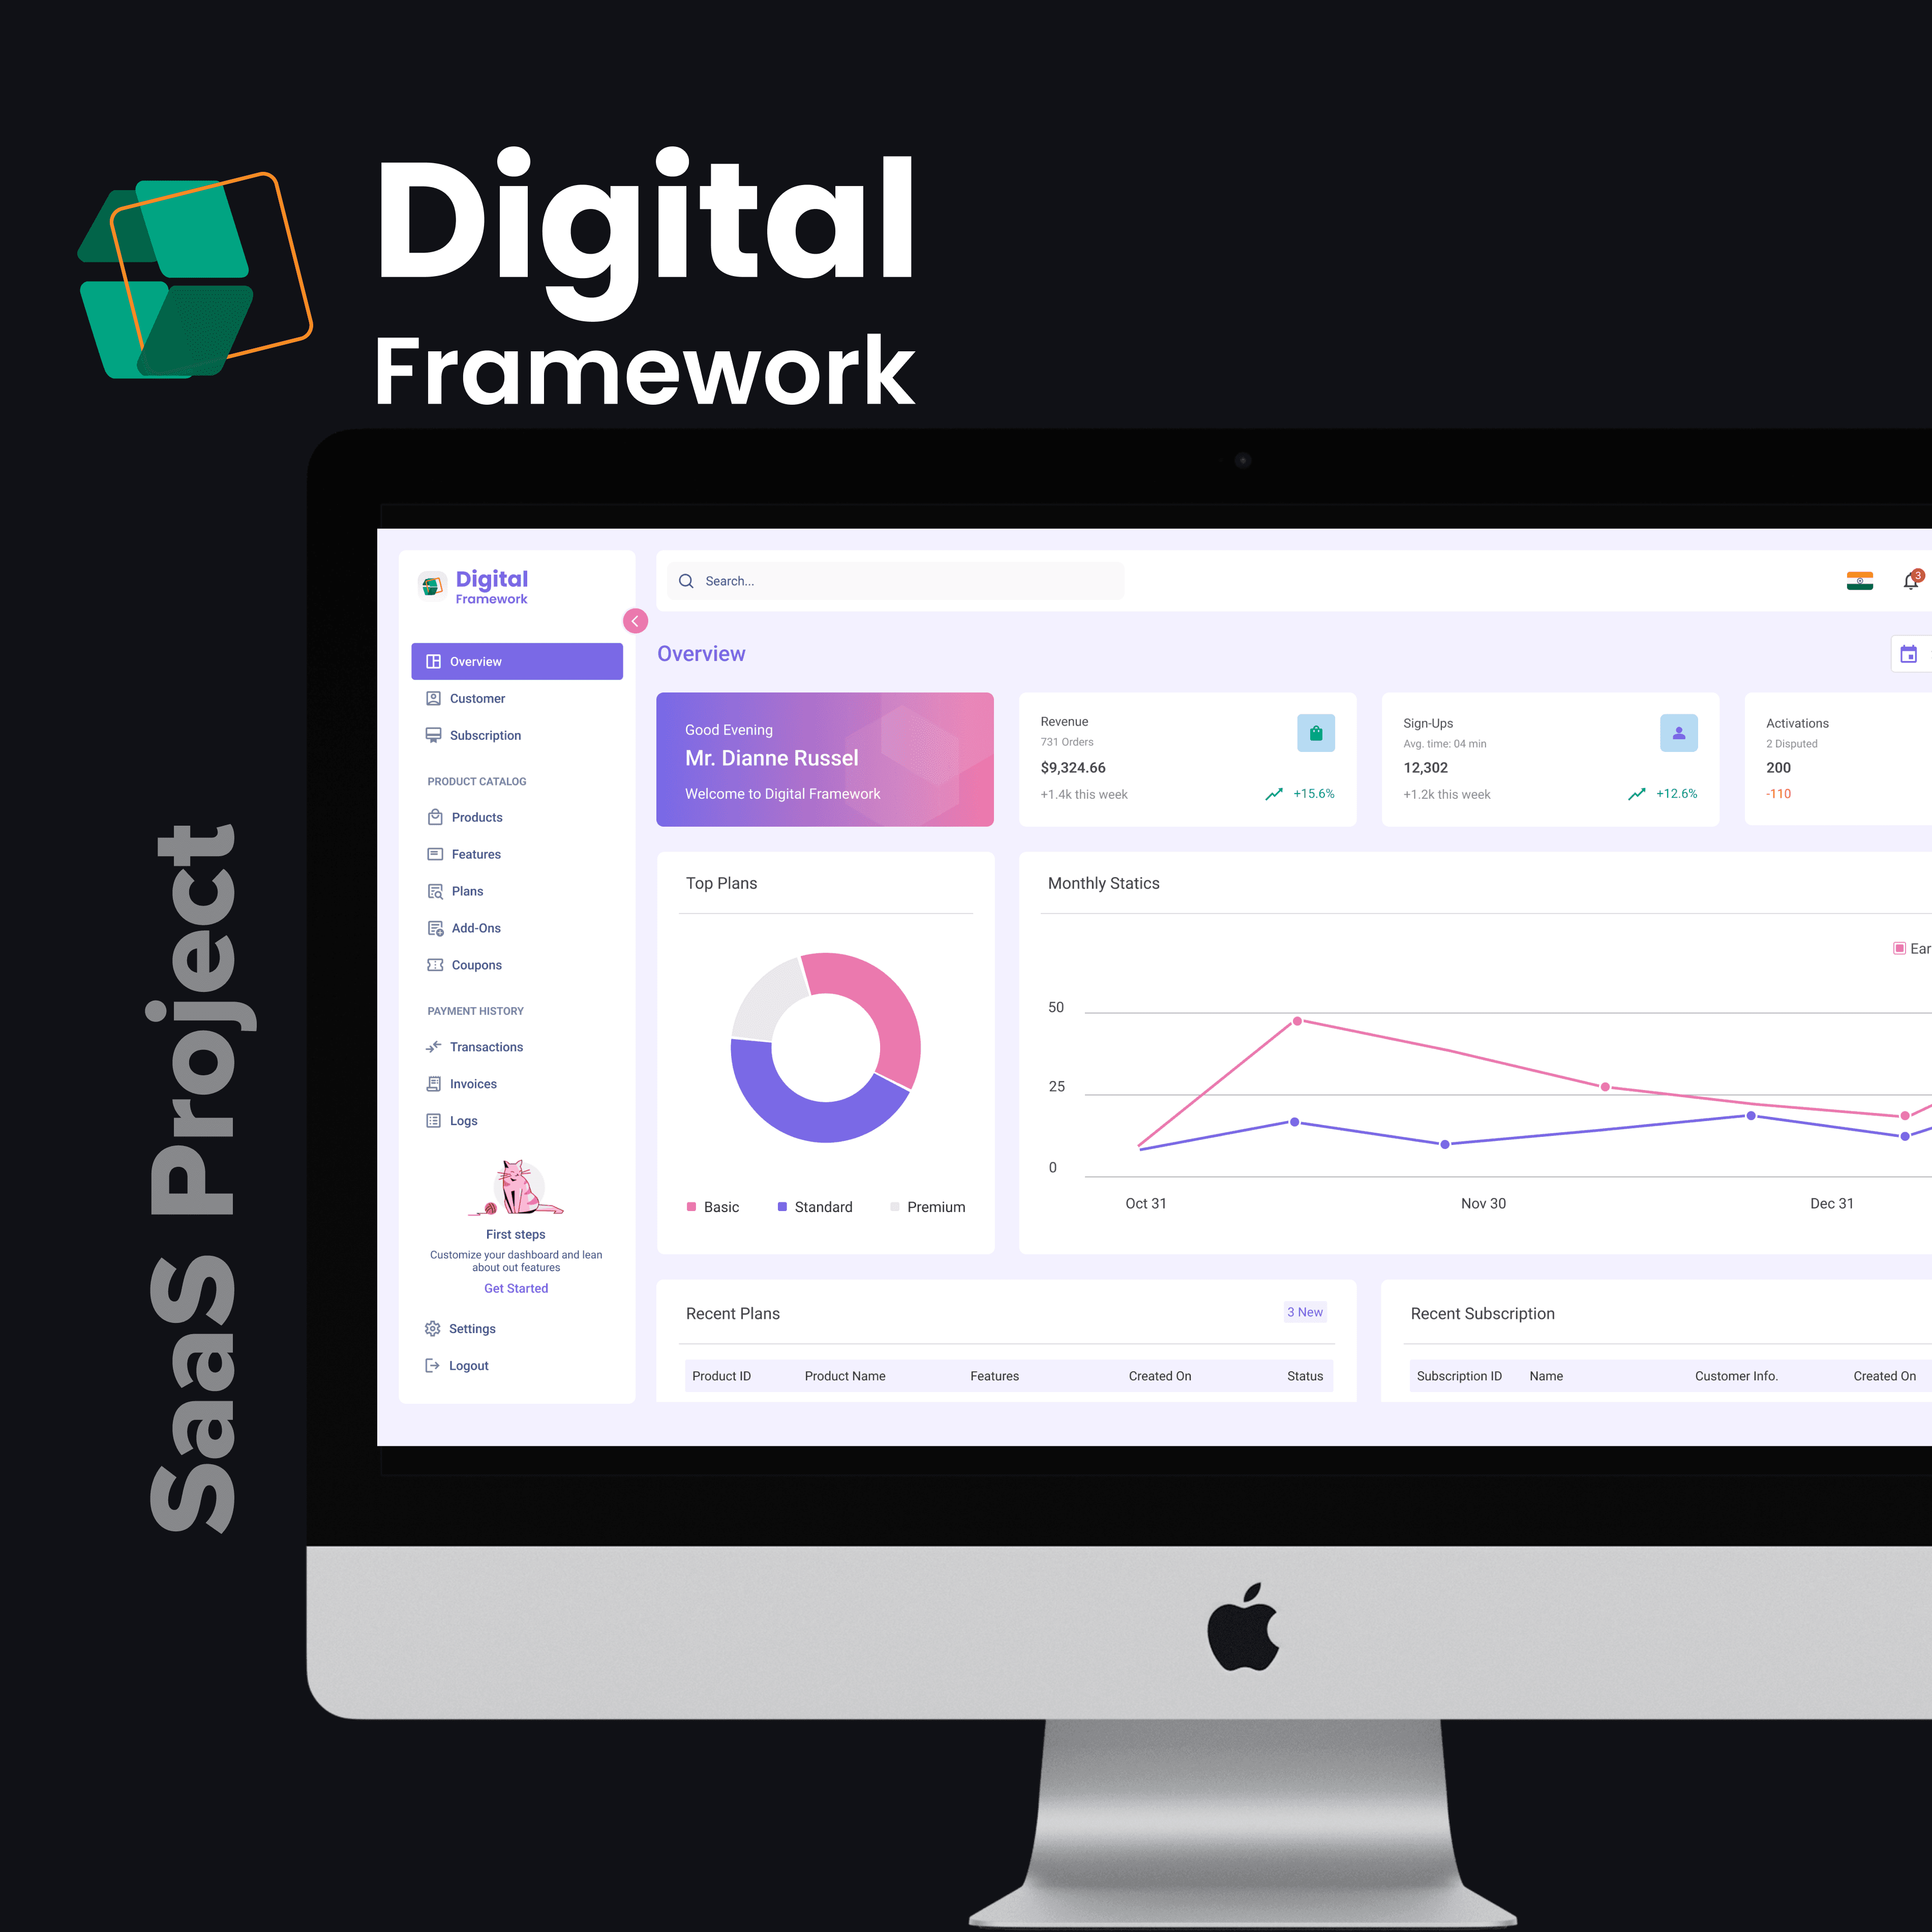
Digital Framework is a subscription, billing, and revenue growth management application that helps businesses manage these with panache. It offers an effective suite of tools for automation in billing, customer relationship management, and optimization of multiple revenue streams. The following is a case study for the dashboard, which was aimed at providing a seamless user experience rich in analytics and intuitive in terms of navigation, helping businesses make informed decisions.
Objective
This was the task as a UI/UX Design Lead: design the full and most user-friendly dashboard for Digital Framework to help users easily manage their revenue operations, get detailed analytics, and conduct any other actions in the easiest form.
Research and Insights
1. User Feedback and Requirements:
In-depth interviews with potential users to understand their requirements and pain points.
Identification of the key features and usability issues was done by insights gathering from businesses already using similar platforms.
2. Competitive Analysis:
Reviewed other revenue growth management apps like Chargebee to spot best practices and areas of improvement.
Examined common user flows and functionalities to make sure that the standards we had set were up to the mark in the market requirement for dashboards.
3. Usability Testing:
Prototypes have been developed for discovering the problems and collecting feedback through usability tests.
This feedback has been used to iterate and enhance the design further before its final implementation.
Key Design Challenges
1. Complex Data Representation:
- Fast access to complex revenue data with good comprehension by the users was achieved.
2. Navigation and Usability:
- Ensuring that the dashboard is user-friendly and intuitive to all users, regardless of their technical level.
3. Customization and Flexibility:
The ability to tailor the dashboard in order to view data of importance to specific needs and preferences.
Design Solutions
1. Simplified Data Visualization:
Clear and concise charts, graphs, and tables represented very complex data.
Designed the visual hierarchy, emphasizing prime metrics that would make it easier to interpret data.
2. Easy Navigation
• Clear sidebar designed with categorized sections for accessing various functionalities.
• Added a global search facility so that information could be located easily and quickly by the user.
3. Personalize Your Dashboard
• Drag-and-drop widgets provided to allow users to customize their dashboard layout.
It allowed users to save multiple dashboard views for different use cases.
Components of Dashboard
1. Overview Page:
A view of the key metrics viz., Total Revenue, MRR, No. of Customers, and Churn Rate.
Featured a timeline view to track how revenues, and other important trends, have grown over time.
2. Revenue Analytics:
Provided detailed breakdowns of revenues by product, customer segment, and geographic region. Included predictive analytics to forecast future revenues and spot potential growth opportunities.
3. Subscription Management
Tools to manage subscription plans, including plan creation, update, and delete.
The system provided the ability to view and manage a single customer subscription and billing history.
4. Customer Insights:
- Full customer directory with contact information, subscription history, and interaction logs
- Customer segmentation tools against various criteria for focused marketing and retention campaigns
5. Billing and Invoicing:
- Automation of billing processes with the ability to customize invoice templates.
Clearly displayed pending and completed payments, with the ability to manually adjust them when necessary.
6. Alerts and Notifications
• Enabled the user by implementing alerts on key events of subscription renewal, failure in payment, or major changes in revenue.
• Integrated with e-mail and SMS to deliver such notifications directly to end-users.
Development and Testing
1. Prototyping
Designed interactive prototypes to test the design and functionality of the dashboard.
Ran usability testing in rounds with real-time users to collect feedback and run further changes.
2. Iterative Design Process:
Kept designing the iteration based on agile methodologies empowered by user feedback.
The prioritization of key features and improvements ensured that the dashboard would meet user needs and expectations.
3. Launch and Onboarding
- Built detailed onboarding tutorials and documentation to get our users up and running with the new dashboard
- Provided customer support to iron out any kinks and collect feedback for future iterations
Results
Stronger User Engagement
The new dashboard saw increased user interaction and satisfaction due to its intuitive design and clean data visualization.
They felt that their revenue operations could be managed more easily, with driving of data-driven decision-making.
Productivity Improvement
• With improved navigation and the ability to customize it in a way that would best suit users, every task could be done more quickly.
• The revenue management processes of businesses were improved, and therefore on the whole as well.
Positive Feedback
• Users liked the aesthetic appeal of the dashboard, its usability, and powerful analytics.
Bringing custom views all the way to the dashboard was very well received.
Conclusion
The dashboard redesign solved the challenges of data complexity, navigation, and customization for Digital Framework. This holistic, user-friendly design helped improve the general user experience and helped businesses to better manage their revenue growth management processes.
Future Steps
1. Incremental Improvement:
• Update the dashboard regularly based on user feedback and emerging trends.
• Innovate with new features to stay competitive and meet the evolving needs of users.
2. Advanced Analytics:
• Build advanced analytics capabilities, such as AI-driven insights and machine learning models that go deep into revenue analysis.
3. Community Engagement:
Establish a community of users for sharing best practices, tips, and other feedback.
Encourage user-generated content and collaboration in driving future improvements and innovation.


